





Spot Opportunities & Trade with Confidence. Open a Free Trading Account Today!
+91

Login for real-time prices and trading.
Loading OI data...
Total Put OI
-
Total Call OI
-
PCR
-
Max Pain
-
ATM IV
-
Strike range
The tool pre-loads NIFTY50 with the nearest weekly expiry. Without an account, the following is accessible:
Not available without logging in:
The pre-login view is analytical only, with no execution available.
The tool currently shows NIFTY 50 on 15-minute delayed data. Here is what each section tells you.
The OI table displays the number of outstanding contracts for all calls and puts at each strike price. This can be used by traders to see where the majority of the contracts are being built up.
Change in OI refers to the change in the total number of outstanding options contracts. A rising OI indicates that new buyers are entering the market, or that new contracts are being written, and a lower OI indicates that traders are closing out their positions.
PCR is calculated as Total Put OI / Total Call OI. It is primarily an indicator of the overall market sentiment.
Volume PCR is based on the volume traded today, rather than the accumulated OI. It reflects intraday sentiment, not structural positioning.
To interpret OI signals, traders need to consider more than just the numbers; they need to grasp the dynamics between options buyers and options sellers. Here's how:
The strike with the highest Call OI acts as the resistance. Call sellers (writers) have invested heavily, and they believe that the price will not rise above this level before the expiry.
Conversely, the strike with the highest Put OI acts as the support. Sellers are bearish at this price level and are putting up a strong fight to prevent the price from breaking below this level.
When the PCR is above 1, it means that more volume has been traded in puts than calls, which is a bearish sentiment. A PCR below 1, on the other hand, means that the call volume exceeded the put volume, which is a bullish sentiment.
Long Buildup is when price increases with increasing OI, which means that new buyers are entering the market. The opposite is Short Buildup, which is a decrease in price and an increase in OI, which signals fresh selling pressure.
Short Covering occurs when the price is rising but the OI is falling, which means that the shorts are closing out their positions and not new longs entering. Long Unwinding is a period of price decline and OI is declining as well, indicating longs are closing out their positions.
Open Interest is the total number of options contracts currently open, which are not yet settled, exercised, or closed. OI is not reset daily like volume, but rather builds up over sessions and indicates the outstanding contracts at a strike. Volume indicates what was traded today, and OI indicates to traders what is still in play.
When a new buyer and a new seller initiate a fresh contract, OI increases by 1. If an existing buyer sells their contract to an existing seller (both squaring off), OI decreases by 1. If an existing buyer transfers their position to a new buyer, the total OI remains unchanged.
On Options Trader, traders can control how many strikes above and below the ATM appear in the table, with the 30 / 20 / 10 / 5 toggle, and it is available pre-login. Furthermore, the Min/Max inputs let traders set a custom price range instead of relying on the ATM-relative toggle.
At-The-Money (ATM) is the strike price that is the closest to the underlying asset's spot price. The strike range toggles limit the table to the specific number of strikes above and below this exact ATM level. Strikes above ATM are out-of-the-money for calls and in-the-money for puts, and the reverse applies to strikes below ATM.
A narrow strike range is best for intraday scalpers who are only interested in the resistance and support around the ATM strike. In contrast, the wide strike range is preferred by directional swing traders and options sellers to gain exposure to a broader market structure and positioning.
Logging into the Options Trader unlocks the following:
The 15-minute delay is removed, granting traders access to real-time OI, Change in OI, PCR, and Volume PCR updates.
Pre-login is limited to the nearest weekly expiry for NIFTY (by default), F&O-eligible stocks, commodities, and all indices. After logging in, all weekly and monthly expiries can be selected.
Post-login extends access to real-time data of F&O-eligible stocks, commodities, and indices on the platform.
Some key terms that every options trader should know are:
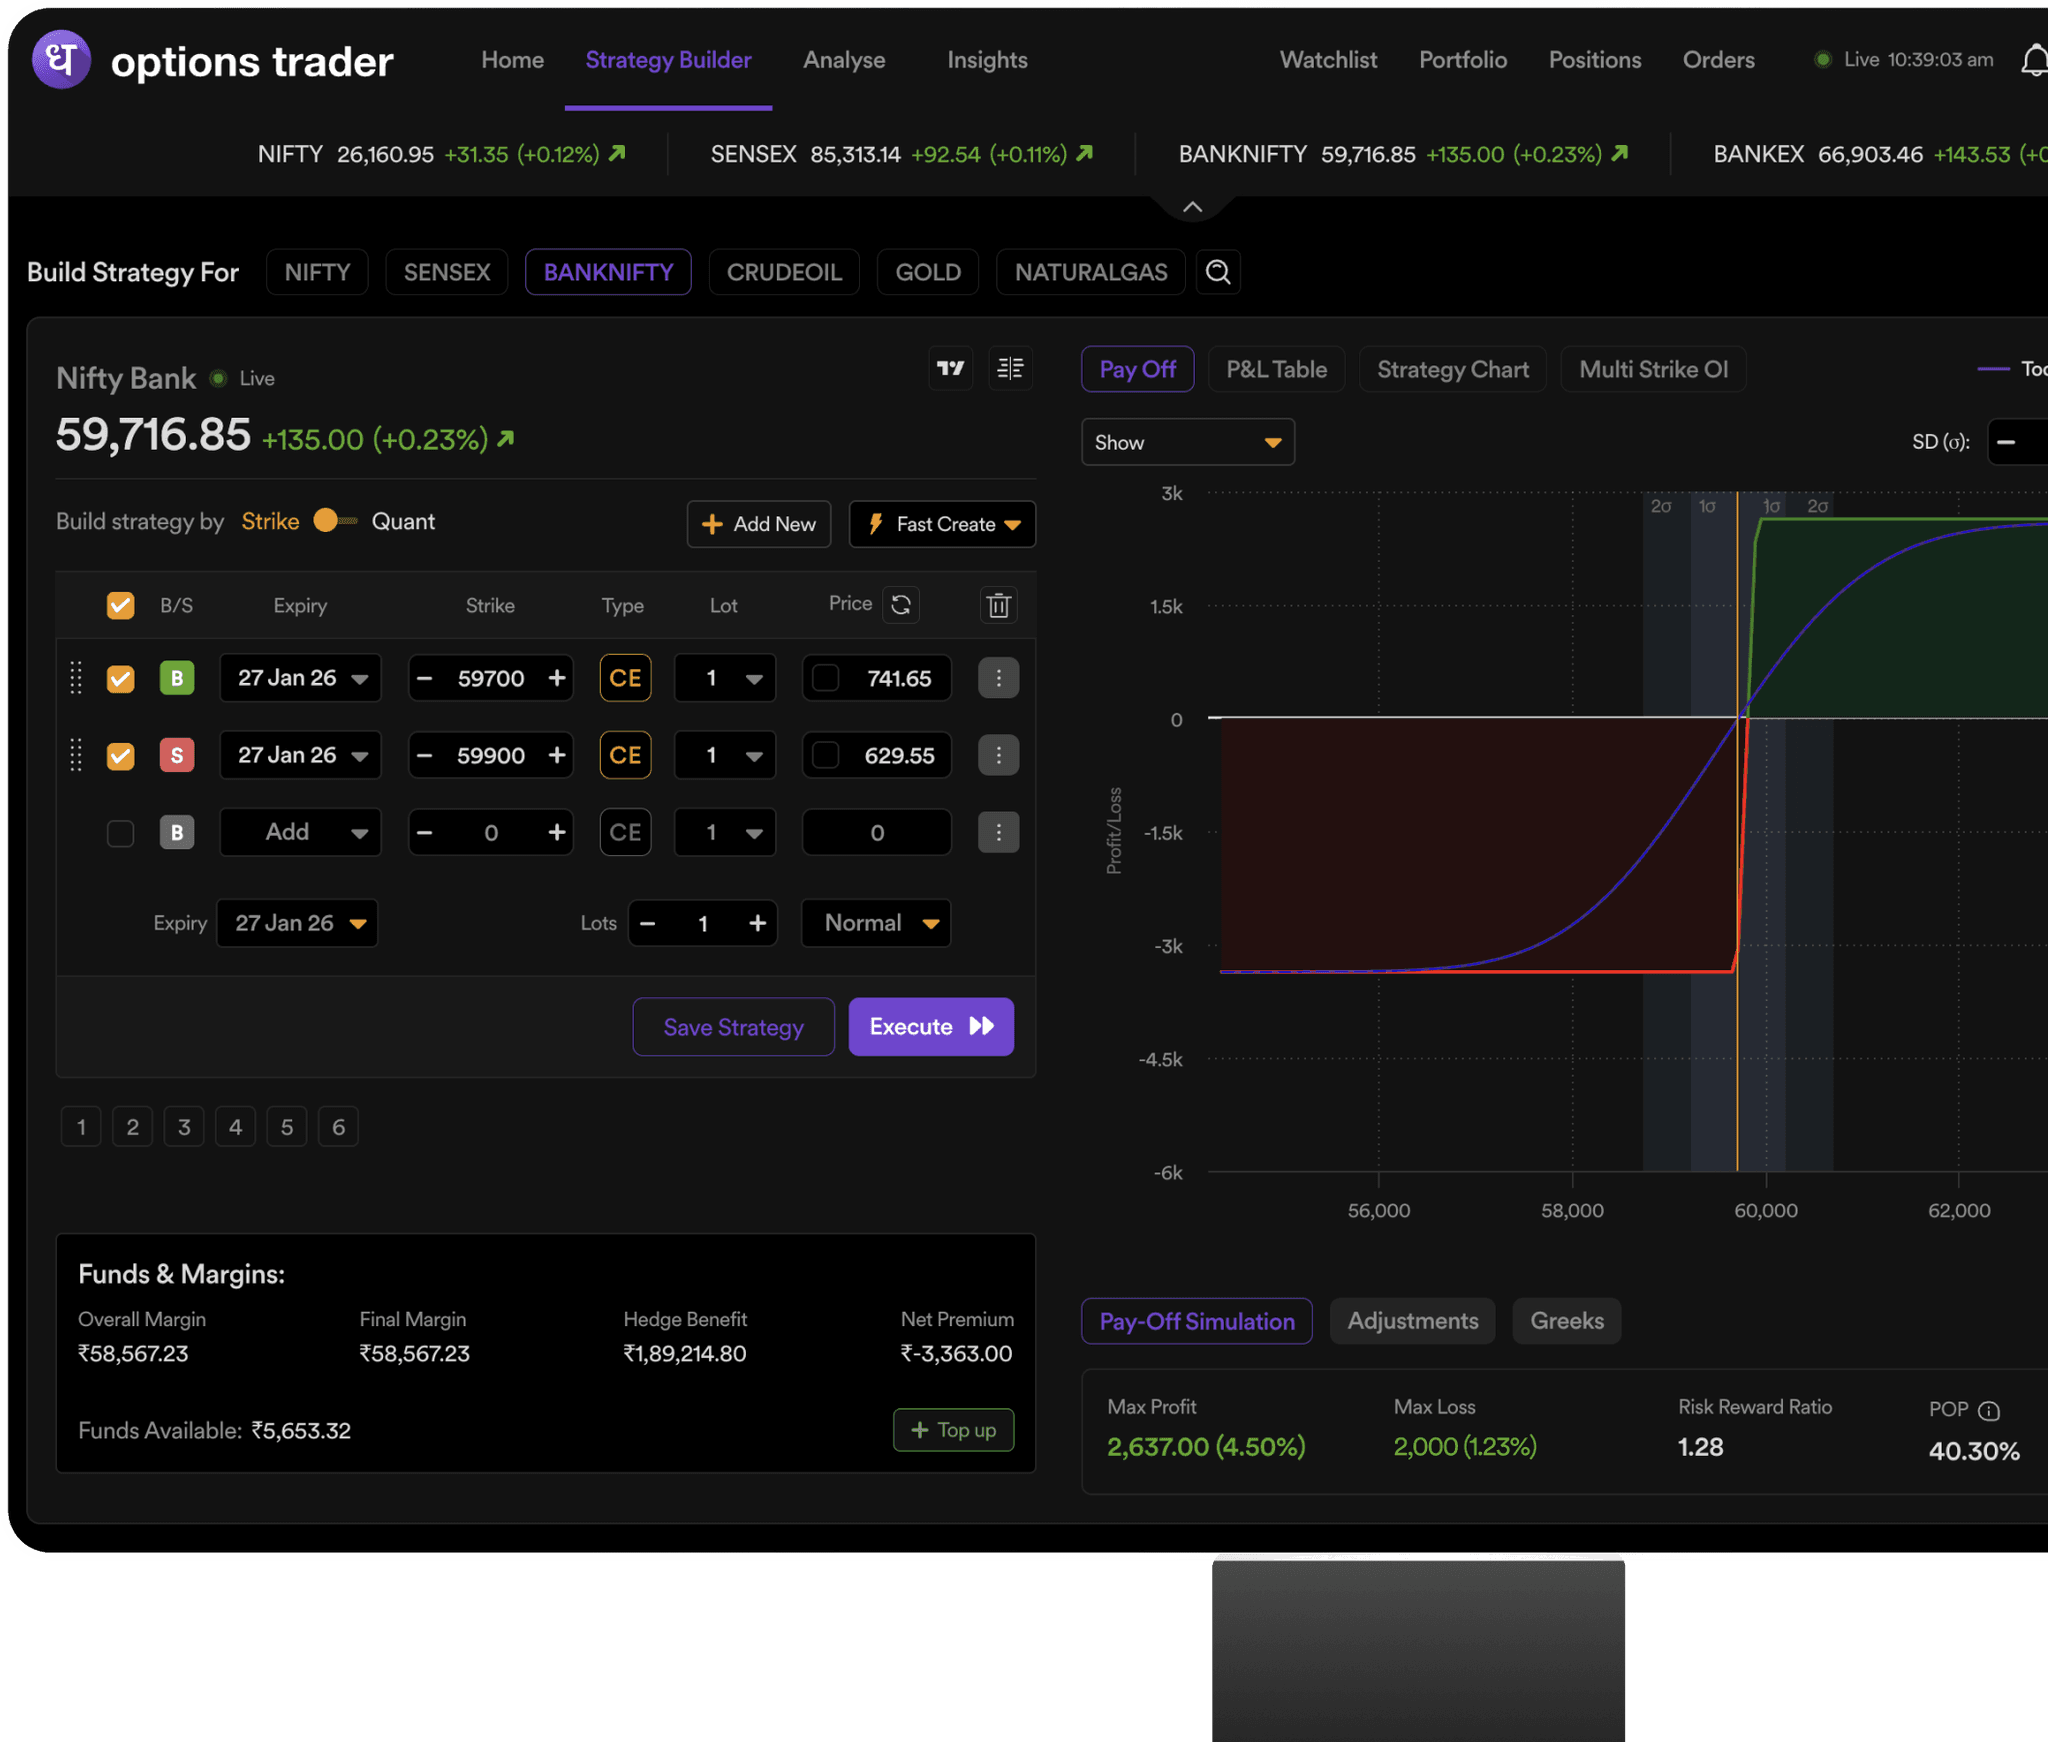
Options Trader translates raw exchange data into a clean, visual format. Powered by Dhan's proprietary DEXT execution engine, the platform updates strike-level data seamlessly. The Multi Strike OI chart works as a companion view, allowing traders to visually map accumulations and transition smoothly from analysing support levels to executing a multi-leg strategy within the same dashboard.
Options trading involves significant risk and is not suitable for all investors. As per SEBI, 9 out of 10 individual traders in the equity F&O segment incur net losses. OI data reflects where participants are positioned; it does not predict price direction. Therefore, traders should use open interest as one input among several, and always define their maximum risk before entering any trade.
Volume is the total number of trades that have been executed during the day, and OI represents the total number of outstanding options contracts that have not been settled, expired, or exercised.