






Spot Opportunities & Trade with Confidence. Open a Free Trading Account Today!
+91

Login for real-time prices and trading.
The Options Buildup loads with NIFTY 50 by default. Without logging in, you can view:
All data reflects a 15-minute delay. NIFTY 50 loads by default. SENSEX and Nifty Bank are only one tap away, present as quick tabs. Through search, you can switch to other indices, F&O stocks, and commodities, but with the same 15-minute delayed data.
You need to log in to add strikes to a basket, execute trades, and access future expiries beyond the nearest one.
The default view displays the NIFTY 50 for the most recent expiry. The layout is structured as Call options (CE) on the left, Put options (PE) on the right, and the Strike Price in the centre. The At-The-Money (ATM) strike is highlighted for easy reference.
Each strike has a tag next to the standard metrics that shows the current buildup status. This tag is based on the relationship between price movement and OI changes, giving you a quick visual indication if a particular strike is being aggressively bought, sold or if it is being liquidated.
Each row shows LTP, OI, and Volume for the CE and PE at each strike.
These three columns are read alongside the Buildup tag, not in isolation. A Buildup signal carries significantly more weight when backed by high volume and high OI.
The Options Buildup offers three distinct ways to view the same buildup data:
Buildup is most useful when you analyse the pattern behind the tag, not just the tag itself. Here's how:
When both prices and Open Interest increase simultaneously, it suggests fresh long positions are entering the market. It is often interpreted as a bullish market signal, as traders are willing to pay higher prices and open interest is also rising.
It typically indicates fresh short positions are entering. It is interpreted as a bearish signal as price is declining while open interest is increasing.
Short Covering is when the price rises and open interest declines. It implies that the shorts are exiting positions, which decreases the total OI. This can lead to sudden and steep price surges.
A decline in both prices and Open Interest indicates that the long buyers are closing their positions (selling to close), which may be because of profit-booking or capitulation. Selling pressure pushes prices down while total active contracts decline.
A single strike showing Long Buildup is a data point. Four consecutive CE strikes showing Long Buildup while the market is rising is a pattern. Traders analyse the data as a ladder, not as isolated rows. Contract View and Chart View are useful follow-up steps once a cluster is identified in Chain View.
Options Buildup classifies the positioning activity at each strike by combining OI change with price direction. It tells you more than OI change. OI change alone tells you whether contracts were opened or closed, but it does not indicate whether buyers or writers drove the activity.
Buildup pairs OI change with price direction to infer which side is likely responsible. For example, rising OI with rising price signals that buyers are driving the activity.
The Buildup tag is calculated using two inputs: Price direction and OI change into the following four outcomes:
The tag is recalculated as new data arrives. It is a classification based on observable inputs, not a confirmation of positioning intent.
The controls are built to make the Options Buildup tool useful even before login, while still reserving some advanced features for logged-in users.
Before logging in, NIFTY 50 loads by default with 15-minute-delayed data, but you can search and switch to other indices, F&O stocks, and commodities.
The nearest expiry loads by default without login. After logging in, future expiries are available. Changing expiry redraws the entire data for that date.
The toggle buttons on the top of the data table allow you to change formats to Chain View, Contract View and Chart View. This enables you to switch between broad strike scanning, specific contract analysis, and time-based trend analysis. The three formats are accessible without logging in.
After logging in with your Options Trader account, you can remove the 15-minute delay and have full execution capabilities like:
Once logged in, Buildup tags, OI, Volume, and LTP values are updated in real time. The Options Buildup is not a snapshot of prices but a live positioning map that updates as price and OI change during the session.
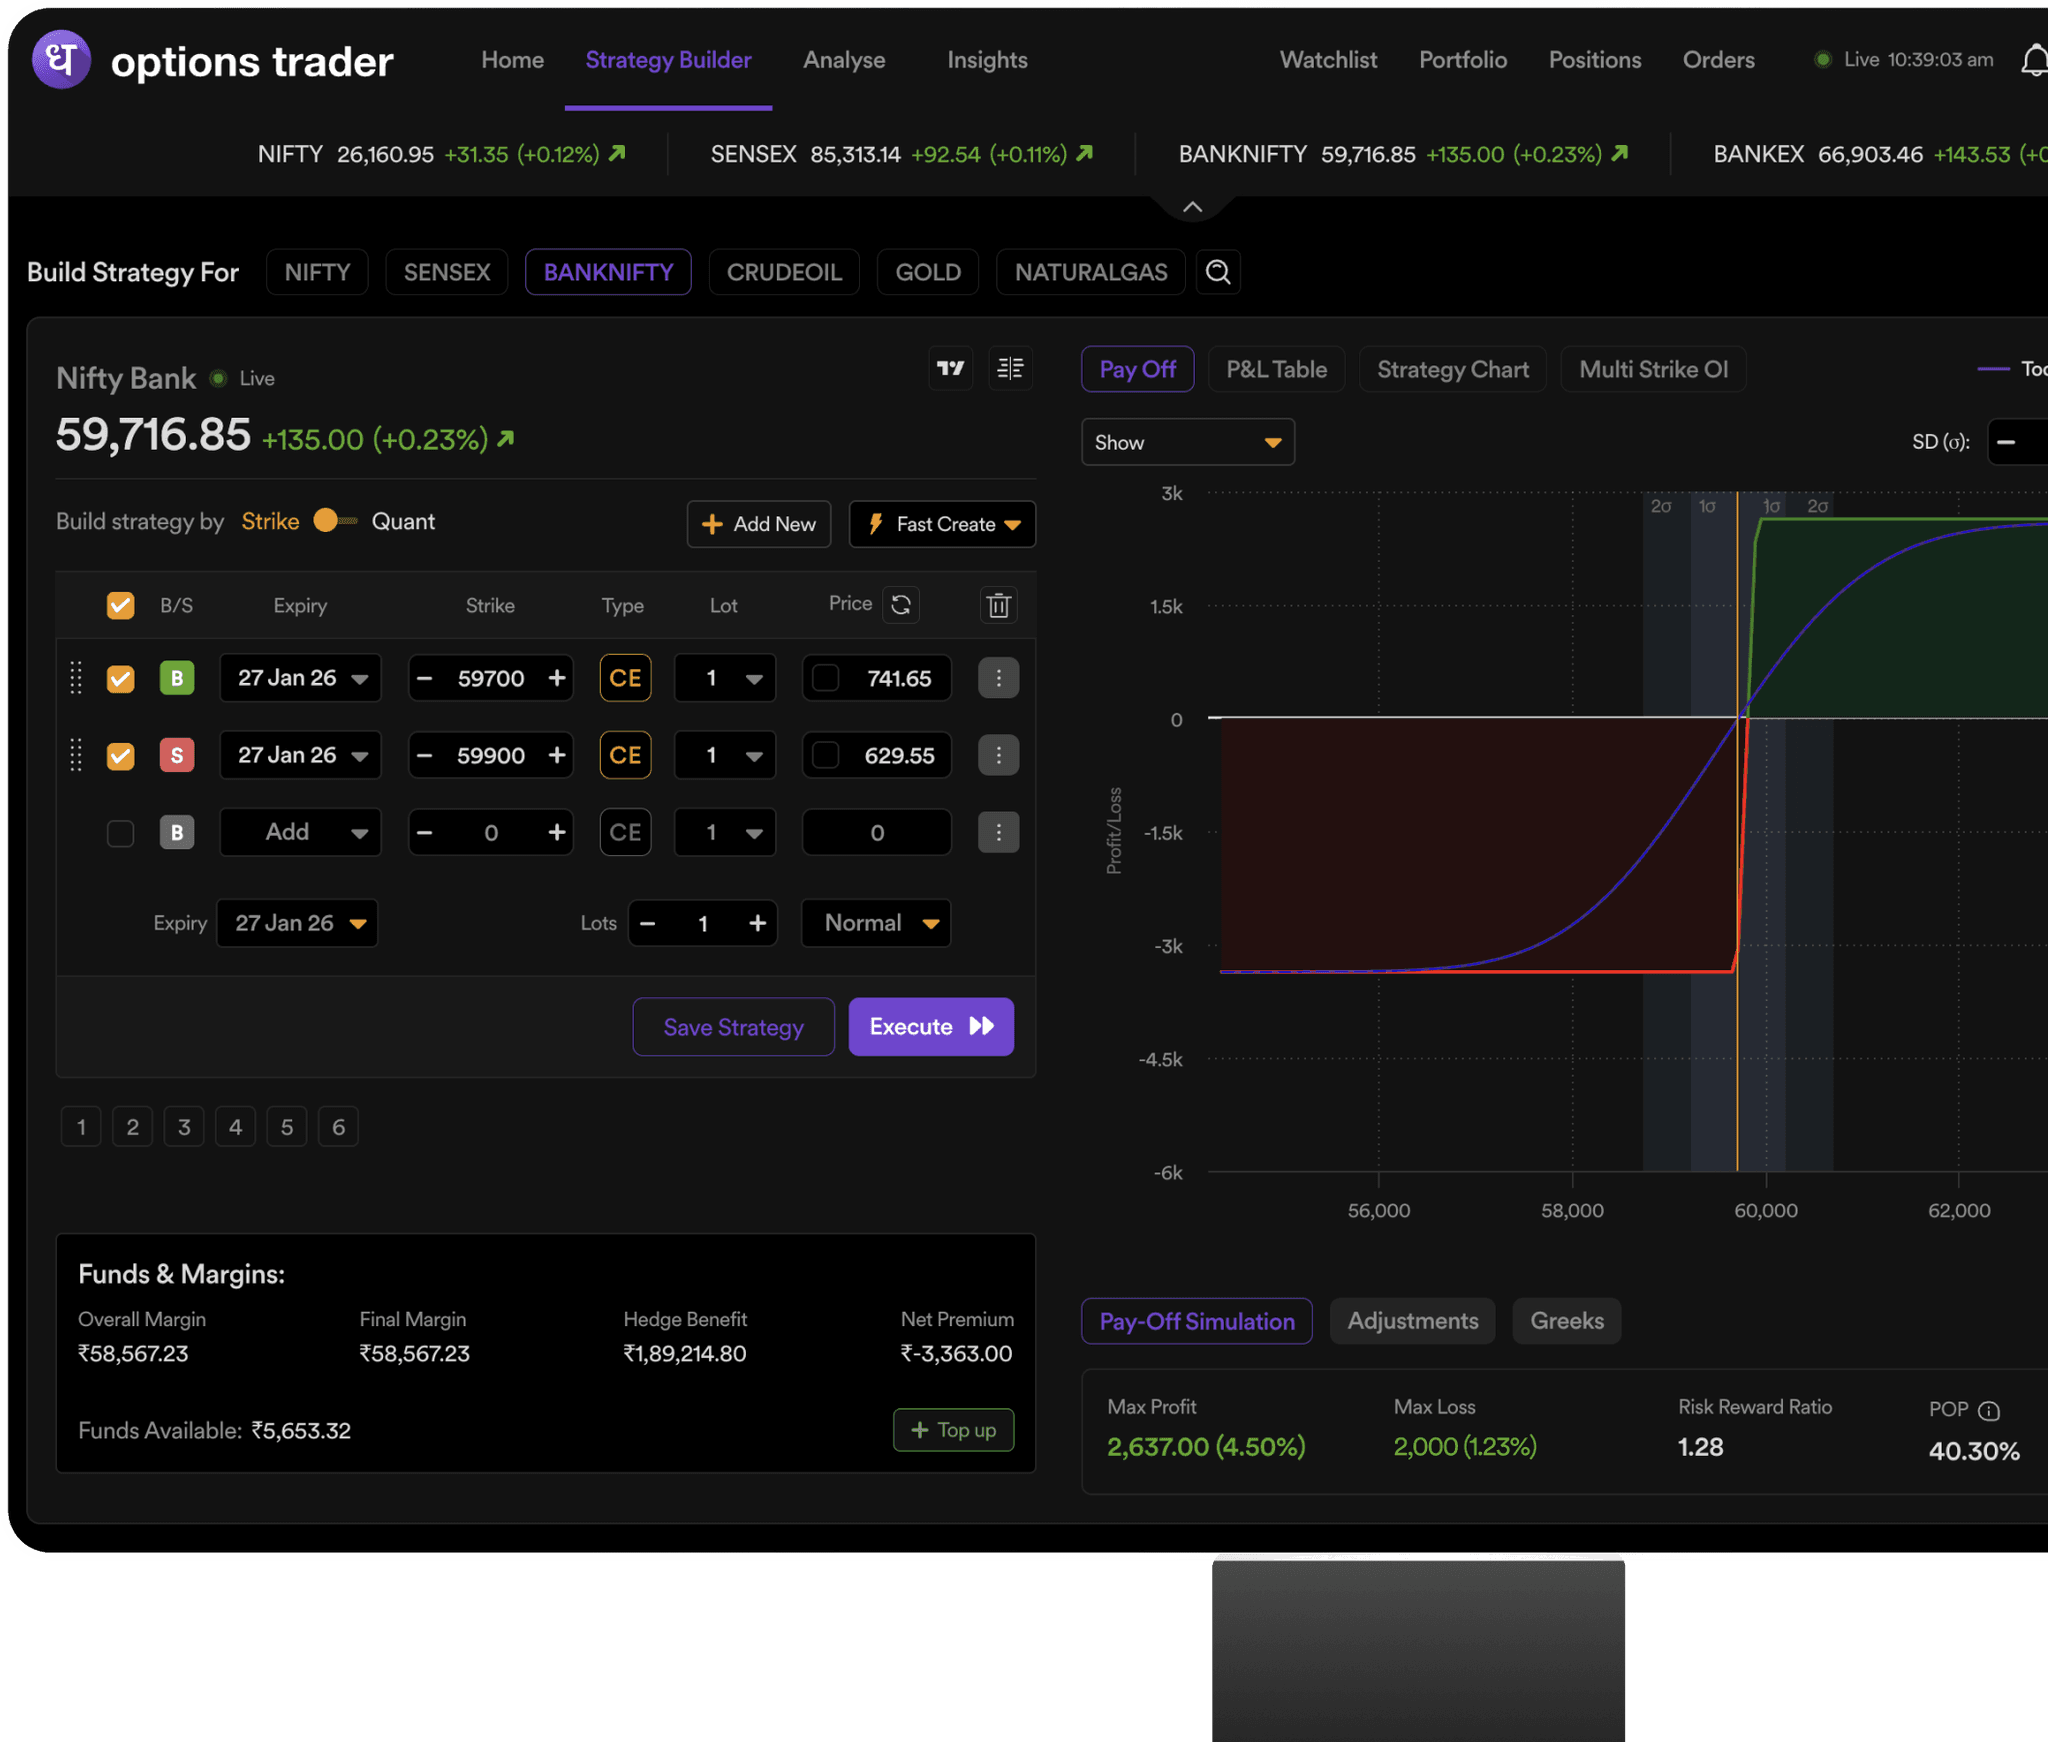
Checkboxes appear next to each CE and PE row. Ticking a box adds that contract as a leg in your strategy panel, with Buy/Sell, lot size, and live price. Additionally, you gain access to Live Overall Margin, Final Margin, Hedge Benefit, and Net Premium.
Once your legs are selected in the strategy panel, you have three execution paths: save the setup to a watchlist for later tracking, push it to a basket to queue it alongside other trades, or click Execute All to route every leg to the exchange simultaneously with no re-entry of strike data required.
Tracking options buildup on Options Trader offers you the following benefits:
Buildup is an interpretation of positioning activity based on price and OI data. It should not be treated as a confirmed signal. Tags can change rapidly within the same session depending on the market conditions.
A cluster of strikes showing the same tag is more informative than a single row. Therefore, before taking a position, traders should verify the Buildup reading alongside price action and other tools.
Both have rising prices. Long Buildup has rising OI (new longs entering); Short Covering has falling OI (existing shorts exiting).