






Spot Opportunities & Trade with Confidence. Open a Free Trading Account Today!
+91

Login for real-time prices and trading.

The BSE Option Chain on Options Trader loads with 15-minute delayed data without logging in. Here is what is accessible without logging in:
This pre-login view provides an analytical overview of the tool's structure before you use it with real capital.
The BSE option chain is a real-time dataset from the Bombay Stock Exchange (BSE) that displays all the available options contracts for different indices like Sensex and stocks at different strike prices and expiry dates. It contains both call (CE) and put (PE) options and metrics such as open interest (OI), volume, implied volatility (IV), change in OI, etc.
The live BSE option chain is different from the traditional price chart as it reflects the market participants' positioning at various levels. It helps traders to spot support and resistance levels, how volatility is priced in, and where large positions are being built.
The derivatives segment of BSE is smaller than the NSE option chain, but has gained momentum with its weekly Sensex and Bankex options. This BSE option chain data is available in an organised format on the Options trader platform and with several advanced tools that make it easier for traders to interpret the BSE Option Chain and execute trades.
The BSE option chain structure is similar to the NSE, but its liquidity and strike distribution differ from NSE. Calls are listed on the left, puts are listed on the right, and strike prices are listed in the middle. Reading the option chain is not about analysing it row by row. Experienced traders interpret it structurally, looking at the distribution of OI, volume, IV, and Greeks across strikes to develop a coherent market view. Let's break down each key component of the BSE Option Chain:
The predetermined price at which the option holder can execute the specific options contract is known as the strike price. The spot price, on the other hand, is the real-time market price of the underlying asset.
The strike price that is closest to the current spot price of an index or stock is known as an At-The-Money (ATM) strike, and it is used as the analytical anchor for all BSE option chain analysis. Strikes above the spot are OTM calls (and ITM puts), and strikes below the spot are OTM puts (and ITM calls).
The BSE option chain is split into two different contracts: calls and puts. The BSE option chain shows the calls (CE) on the left side of the table and the puts (PE) on the right side of the table, and the strike price column is in the middle.
Last Traded Price (LTP) is the most recent traded price of an option contract. Professional traders often track how the LTP of ATM strikes responds to index movement. It helps to understand whether a particular strike is gaining or losing time value and intrinsic value as the underlying asset's price fluctuates.
Volume represents the total number of contracts that have been traded at a particular strike during the current session. It is most useful when interpreted in context, like:
Open Interest represents the total number of outstanding contracts at a particular strike that have not been closed, exercised, or expired. It is one of the most important indicators in any BSE option chain analysis. The four classical price-OI relationships that traders track are:
Implied Volatility reflects the market’s expectation of future price movement and directly impacts option pricing. High IV indicates expensive premiums, whereas low IV indicates lower premiums.
The Option Greeks measure how sensitive an option premium is to different market variables. Professional traders use Greeks alongside the live BSE option chain to understand positioning, volatility exposure, and risk.
| Greek | Measures | What it tells you in a trade |
|---|---|---|
| Delta | Sensitivity of option premium to underlying price movement | Helps traders estimate how much the option price may move if the Sensex or the stock moves by one point. Higher Delta means stronger directional exposure. |
| Gamma | Rate of change in Delta | Indicates how quickly Delta can change during sharp market moves. High Gamma near expiry can lead to rapid premium swings. |
| Theta | Impact of time decay on option premium | Helps traders understand how much premium erosion may occur with the passage of time, especially in weekly expiries. |
| Vega | Sensitivity of option premium to changes in implied volatility | Shows how much the option premium may rise or fall when IV expands or contracts. Vega becomes highly important during event-driven volatility. |
| Rho | Sensitivity to changes in interest rates | Less significant for short-term traders but can influence longer-dated option contracts. |
The following features unlock in the BSE option chain on the Options Trader after login:
After logging in with your Options Trader account, all option chain data updates in real time during market hours. There is no 15-minute lag. LTP, OI, change in OI, volume, IV, and Greeks all reflect the current market state, giving you the accuracy needed for both intraday and positional decisions.
The pre-login view is limited to the next four monthly expiries. After login, you can access all available expiries, including both weekly and monthly contracts, across indices and F&O stocks.
Post-login, open interest and implied volatility chart figures are updated in real time throughout the trading session. You can track new OI additions, real-time unwinding, and IV shifts as they occur. This live view prevents you from taking decisions based on delayed data.
In addition to raw data, traders use derived indicators from BSE Option Chain analysis to gain insights into the broader market structure.
The PCR ratio is calculated as Total Put OI / Total Call OI. It is used to gauge the market sentiment. PCR above 1 means that the put volume is higher than the call volume, which is a bearish market sentiment.
In contrast, when PCR is below 1, it indicates that the call volume is greater than the put volume, signalling a bullish market sentiment. But extremely high PCR (>1.5) is a sign of high pessimism, which is often a contrarian bullish signal anticipating a rebound.
The strike at which the option sellers collectively collect the most premium at expiry and the option buyers collectively lose the most is called the Max Pain strike. It is based on the tendency of underlying prices to converge towards this level as the expiry date approaches.
Max Pain is consistently updated during the expiry cycle as fresh OI is built or unwound. It is most actionable in the last 30 minutes of the BSE expiry day (Thursday). In this window, large option sellers who have written options near Max Pain actively defend it by selling the underlying if it rallies above, or buying if it falls below, thus creating a significant pull toward that strike at close.
The Max Pain on Sensex is much more volatile than Nifty since BSE options have lower OI than Nifty. Hence, a comparatively smaller block of institutional positioning can move the Max Pain level significantly. This implies that traders need to use Max Pain in conjunction with other indicators.
IV is only meaningful when compared with its historical range as well as other volatility indicators, such as India VIX. Like when the India VIX is high, there is fear in the market, and the options premiums are high.
On the other hand, if the India VIX is compressed, the options premiums will be cheap, and buying options with a defined risk will offer robust value.
Professional traders often adjust their trading strategies according to the option chain structure rather than forcing a fixed approach.
A bullish setup occurs when the market shows strong downside protection and resistance is weakening. Common signals include:
This indicates that the market has a defined floor and indicates a potential upside move.
A bearish setup indicates supply dominance and that support is weak. Its key signals include:
These conditions indicate that there is limited upside potential and increased probability of downside movement.
High IV environments inflate premiums, creating opportunities for option sellers. Common strategies include:
In low IV environments, option premiums are relatively low, which favours options buying. Traders often use strategies like:
During intraday trading, it is important to pay attention to the real-time changes and not the static levels. Key elements to monitor include:
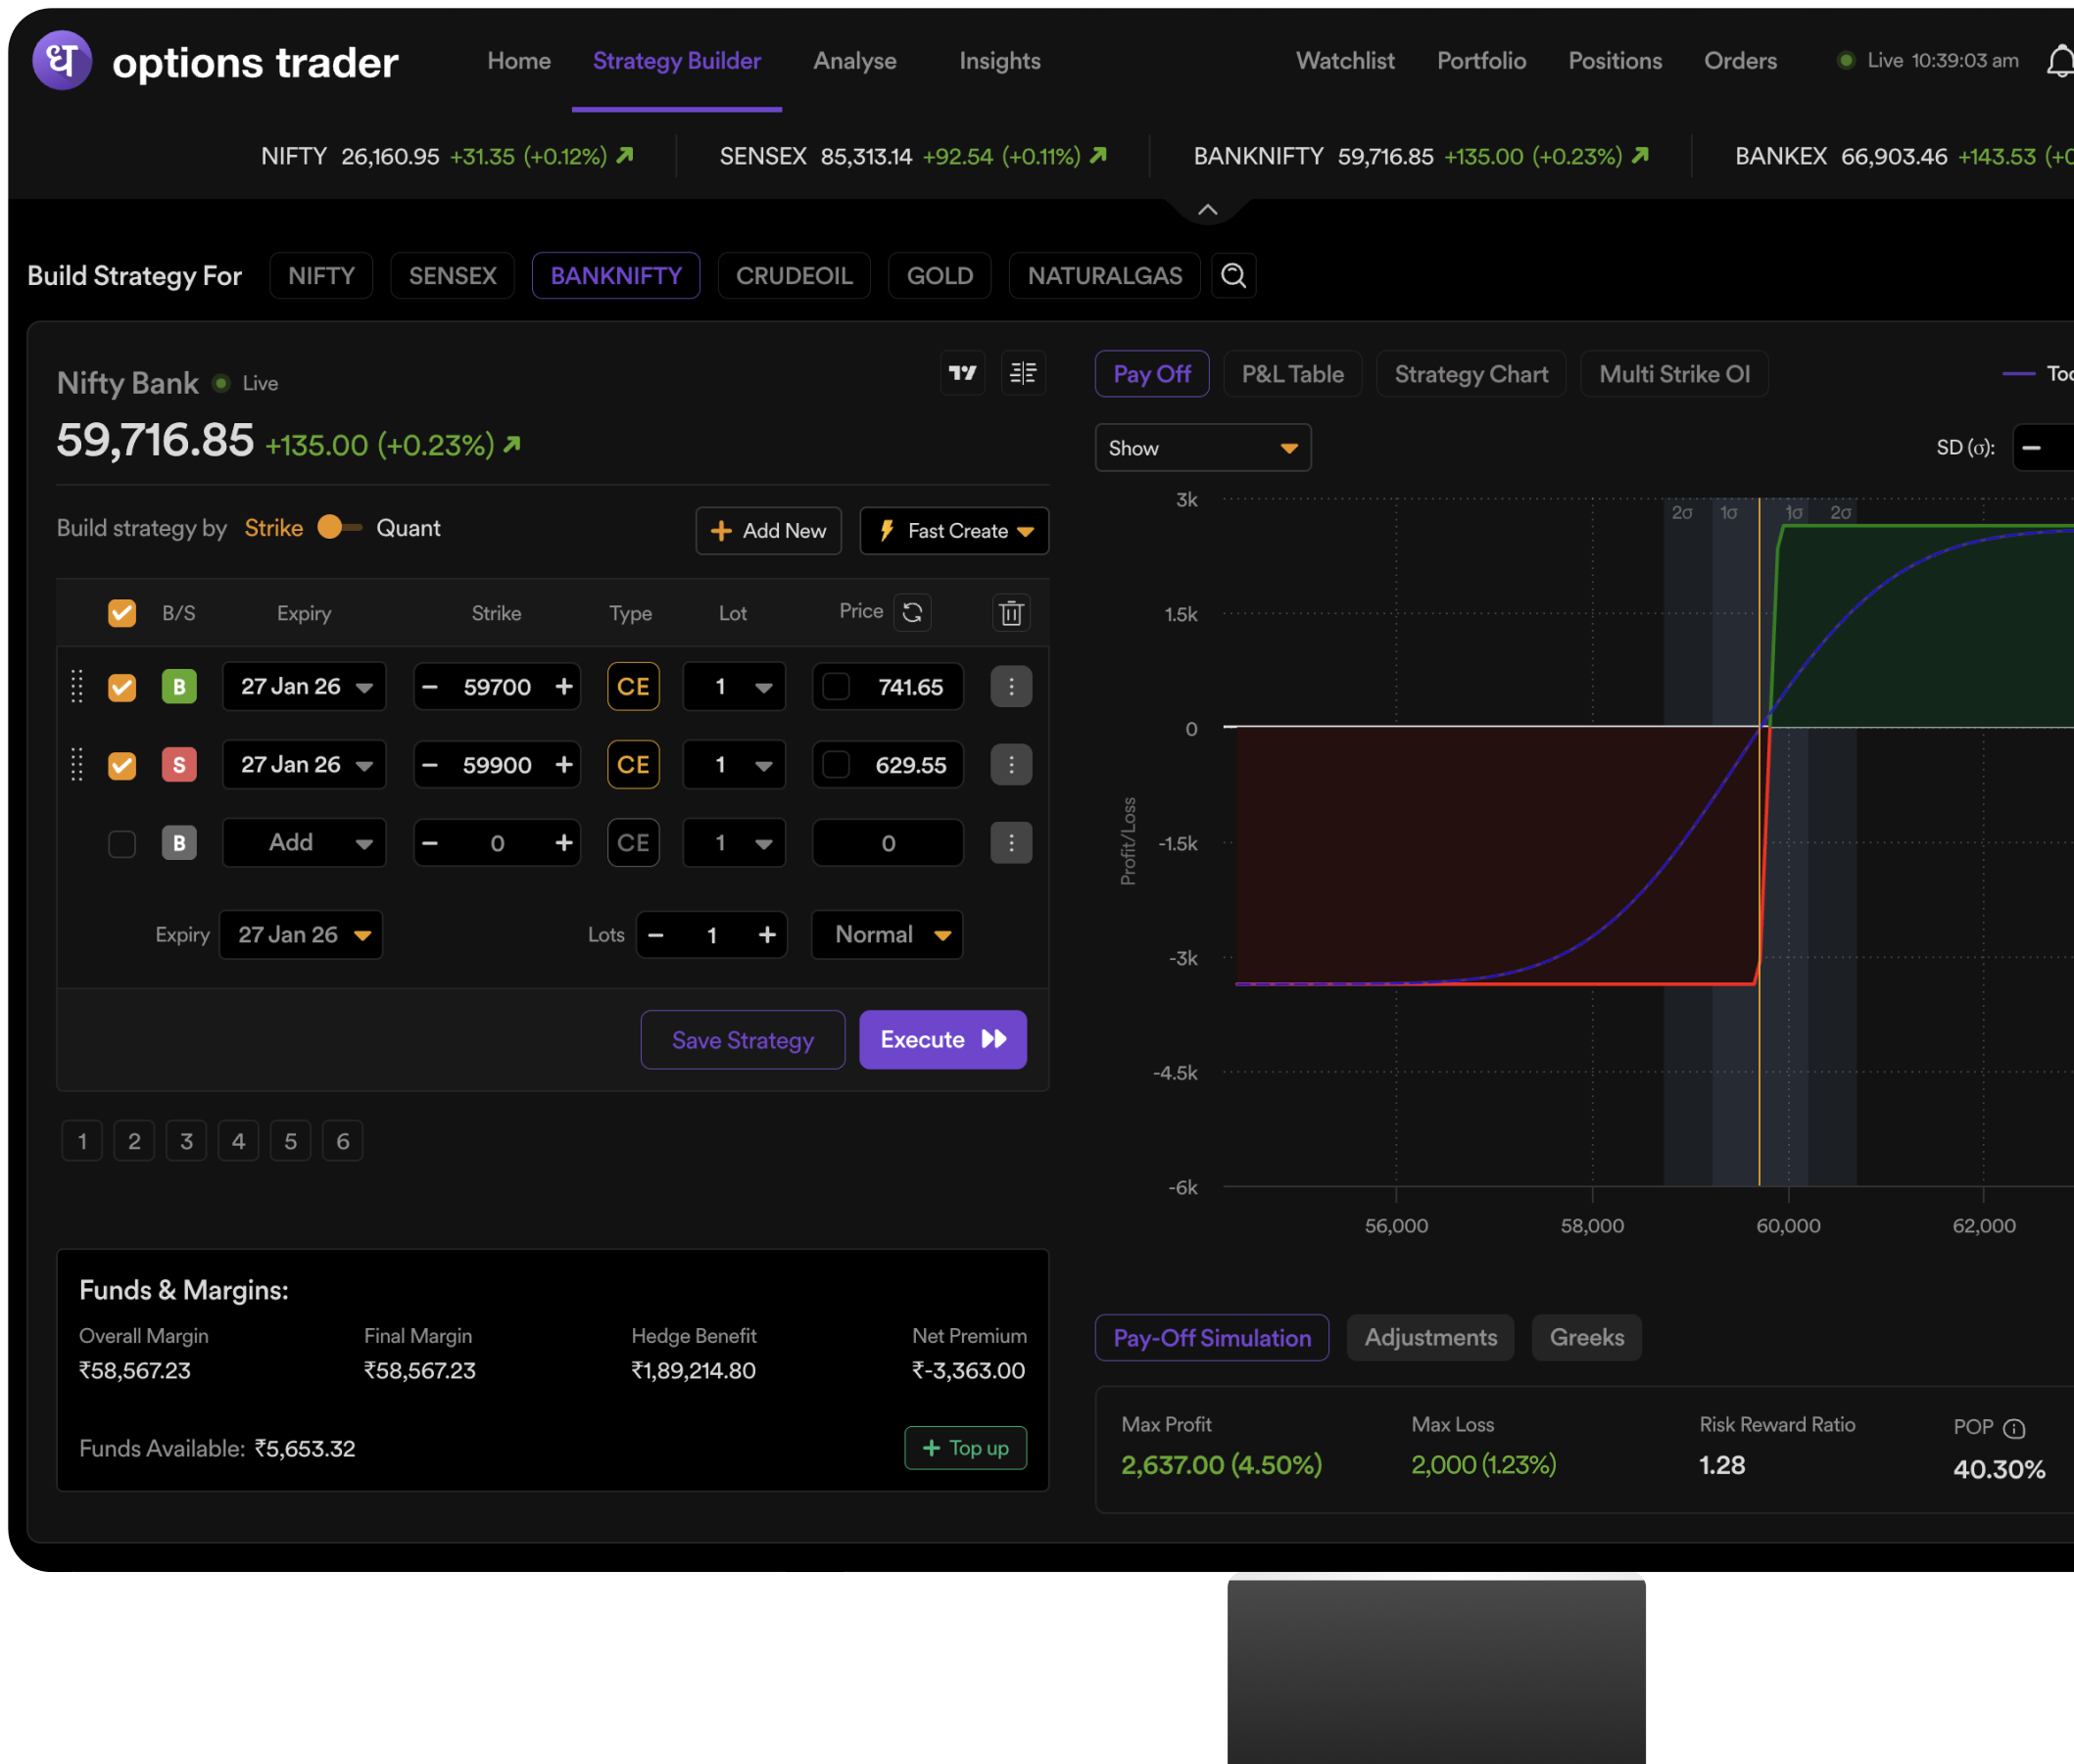
Options Trader enhances the raw BSE option chain data into a structured and actionable interface designed for serious traders. Traders no longer have to manually interpret the data, but rather have a unified view. Key features of Options Trader that make it a preferred choice among traders include:
BSE offers weekly and monthly options expiry, catering to various trading preferences. BSE weekly expiries fall on Thursday, and its monthly expiries fall on the last Thursday of the month. Weekly expiries are faster and more responsive. They are preferred by intraday and short-term traders due to the higher gamma and quick decay of the premium.
On the other hand, monthly expiries provide stability and are more suitable for positional trading strategies, where traders aim to capitalise on a broader trend.
While both exchanges offer derivatives trading infrastructure, there are key differences between the BSE and NSE option chains, such as:
A BSE option chain is a tabular display that lists all the available Call and Put options for a particular underlying asset traded on the Bombay Stock Exchange (BSE). It assists traders in analysing strike prices, premiums, open interest, and implied volatility to build informed options trading strategies. Compared to the NSE, the BSE derivatives segment offers relatively lower liquidity but is slowly gaining traction, especially in Sensex and Bankex options.