






Spot Opportunities & Trade with Confidence. Open a Free Trading Account Today!
+91

Login for real-time prices and trading.
The Option Chain on Options Trader is accessible without a login, with a subset of functionality available to let traders assess the tool before opening an account.
Without logging in, the Option Chain displays data for the next four monthly expiries. Traders can switch between underlyings to view different indices like NSE option chain, BSE option chain or Stocks like Reliance, HDFC, and Commodity option chain like gold, crude oil, etc. The active strikes view can be adjusted to display 5, 10, or 20 strikes, or all active strikes, giving traders a customisable view of the chain depth.
Greeks data are available by default for 6 Greeks. Traders who require the full set of 12 Greeks can access them by selecting through the settings button. The pre-login view reflects a 15-minute delay from live market prices, which enables structural analysis but is insufficient for live execution decisions.
An option chain is a real-time matrix that shows a tabular display of all the available call and put contracts of an index or stock at different strike prices and expiration dates. It contains live data like LTP, Open Interest (OI), Change in OI, Volume, Bid-Ask spreads, and Implied Volatility (IV), which are updated in real time during market hours (only post login users can see real-time data).
The option chain offers an aggregated market positioning. A live option chain is used by professional traders to see the structural changes in the market and where the smart money moves before they are reflected in the price.
This data is primarily sourced from the respective exchange's website. Options Trader brings this same information together, helping options traders to assess market trends, price levels, and build simple or advanced strategies.
Option chains consist of all the available calls and puts for a particular stock or an index in a tabular form. It follows a layout which includes strike prices in the centre; call options (CE) on the left; put options (PE) on the right. Here is what each key column in option chain live indicates:
The strike price is the price at which the option holder can exercise their option contract. It is the primary reference point to determine support and resistance levels. In Nifty 50, the strike price is at 50-point intervals, and in Bank Nifty, the strike price is at 100-point intervals. High Call OI at a strike is a sign of resistance; high Put OI at a strike is a sign of support.
In derivatives trading, there are two types of option contracts: calls and puts.
Last Traded Price (LTP) is the current market price at which a particular option contract is traded. Traders can use this to understand the premium value erosion or expansion in real-time by monitoring the changes in LTP across different strikes. Dynamic tracking of LTP allows traders to determine if an option is trading at a premium or not, depending on market volatility.
Volume represents the total number of contracts that have been traded in one session, which is a measure of market momentum in real time. High volume strikes indicate that there is active participation and higher liquidity to enter or exit a position. High volume combined with increasing open interest is a sign of structural conviction, while high volume and decreasing open interest is a sign of position unwinding.
Open interest refers to the total number of outstanding derivative contracts (such as futures and options) that have not yet been closed, exercised, or expired. It is an indicator of market liquidity and of the money flowing into a specific contract. Here are some important patterns that traders should be familiar with:
Implied Volatility (IV) reflects the market's anticipation of future price swings and directly impacts the options premiums. This expectation is not a directional call, but rather the amount of potential price movement. An IV Chart plots how this expectation shifts over time, making it easier to judge whether IV is currently low or high relative to its own range. A low IV implies that the premiums are cheaper and often indicates that it's a good time to buy, and a high IV means that the premiums are expensive and it's often a good time to sell options at a premium.
Option Greeks are mathematical risk metrics that measure how various factors like price, time, and volatility will impact an option's premium. These five Greeks are used by advanced traders to anticipate price changes and dynamically manage risk:
| Greek | What it measures | Practical implication |
|---|---|---|
| Delta | Sensitivity of the premium to movement in the underlying. | Helps estimate how fast an option may react to price movement. |
| Gamma | The rate of change in Delta as the underlying moves. | Becomes important near expiry, when risk can change quickly. |
| Theta | Time decay in the option premium. | Shows how quickly the premium erodes as expiry approaches. |
| Vega | Sensitivity to volatility changes. | Useful when volatility expansion or contraction may affect premium pricing. |
| Rho | Sensitivity to interest rate changes. | Usually, a smaller factor for short-term traders, but part of the long-term risk view. |
Logging in with an Options Trader account removes the restrictions on the pre-login view and activates real-time data, full expiry coverage, and complete interactivity across the Option Chain.
After login, all option chain data updates in real time during market hours, including LTP, OI, Change in OI, Volume, IV, and Greeks. The 15-minute delay that applies to the pre-login view is removed entirely.
The pre-login view restricts expiry selection to the next four monthly expiries. After login, traders can access all available expiries across weekly and monthly contracts for the chosen underlying.
Post-login access extends to live Open Interest and Implied Volatility figures updated in real time. This matters because OI and IV shifts are often the earliest signals of a change in market structure, having these updates in real time lets traders identify positioning changes as they occur, rather than several minutes after.
Option chain data offers valuable insights into market signals. The analytical backbone of option chain analysis in India is three metrics: PCR, Max Pain, and IV Context.
Put-Call Ratio (PCR) = Total Put OI / Total Call OI. It is a contrarian indicator, which implies that traders often use it to determine when the market is overly bullish or bearish, and it can also indicate a potential price reversal.
If the PCR is greater than 1, then the put volume is higher than the call volume. It indicates an increase in the bearish market sentiment. A PCR below 1 means that the call volume is higher than the put volume. It is an indicator of bullish sentiment coming up.
According to the Max Pain theory, the underlying asset's price will move towards the strike price with the highest number of options that expire worthless. At this level, option buyers suffer the highest losses and option sellers realise the highest profits.
This level is dynamic and varies as new OI is built during the expiration cycle. It is used to gauge the expected settlement price of the underlying asset on the expiration date.
It is most actionable during the last 30 minutes of expiry day when option sellers actively defend their written positions by selling the underlying if it moves above Max Pain or buying if it moves below, leading to a gravitational pull towards the Max Pain strike. Sellers use Max Pain to determine if the market structure is in their favour for a profitable settlement at expiry.
IV Context is the process of analysing the individual option IV in the context of its historical range and in comparison to the broader India VIX reading. When the India VIX is high, it indicates fear in the market, and makes the options premiums expensive.
Conversely, during periods of contraction in India VIX, the premiums are low, which makes buying options with a defined risk a robust risk-reward proposition.
In today's rapidly changing landscape, a robust option chain strategy is crucial to trade successfully in the Indian capital markets. Some of the key strategies include:
The setup is said to be bullish if there is a substantial rise in put OI at lower strike prices while the call OI is decreasing at higher strike prices. This signals that the writers have strong confidence in the stock price holding above those put strikes, offering a structural floor for the market.
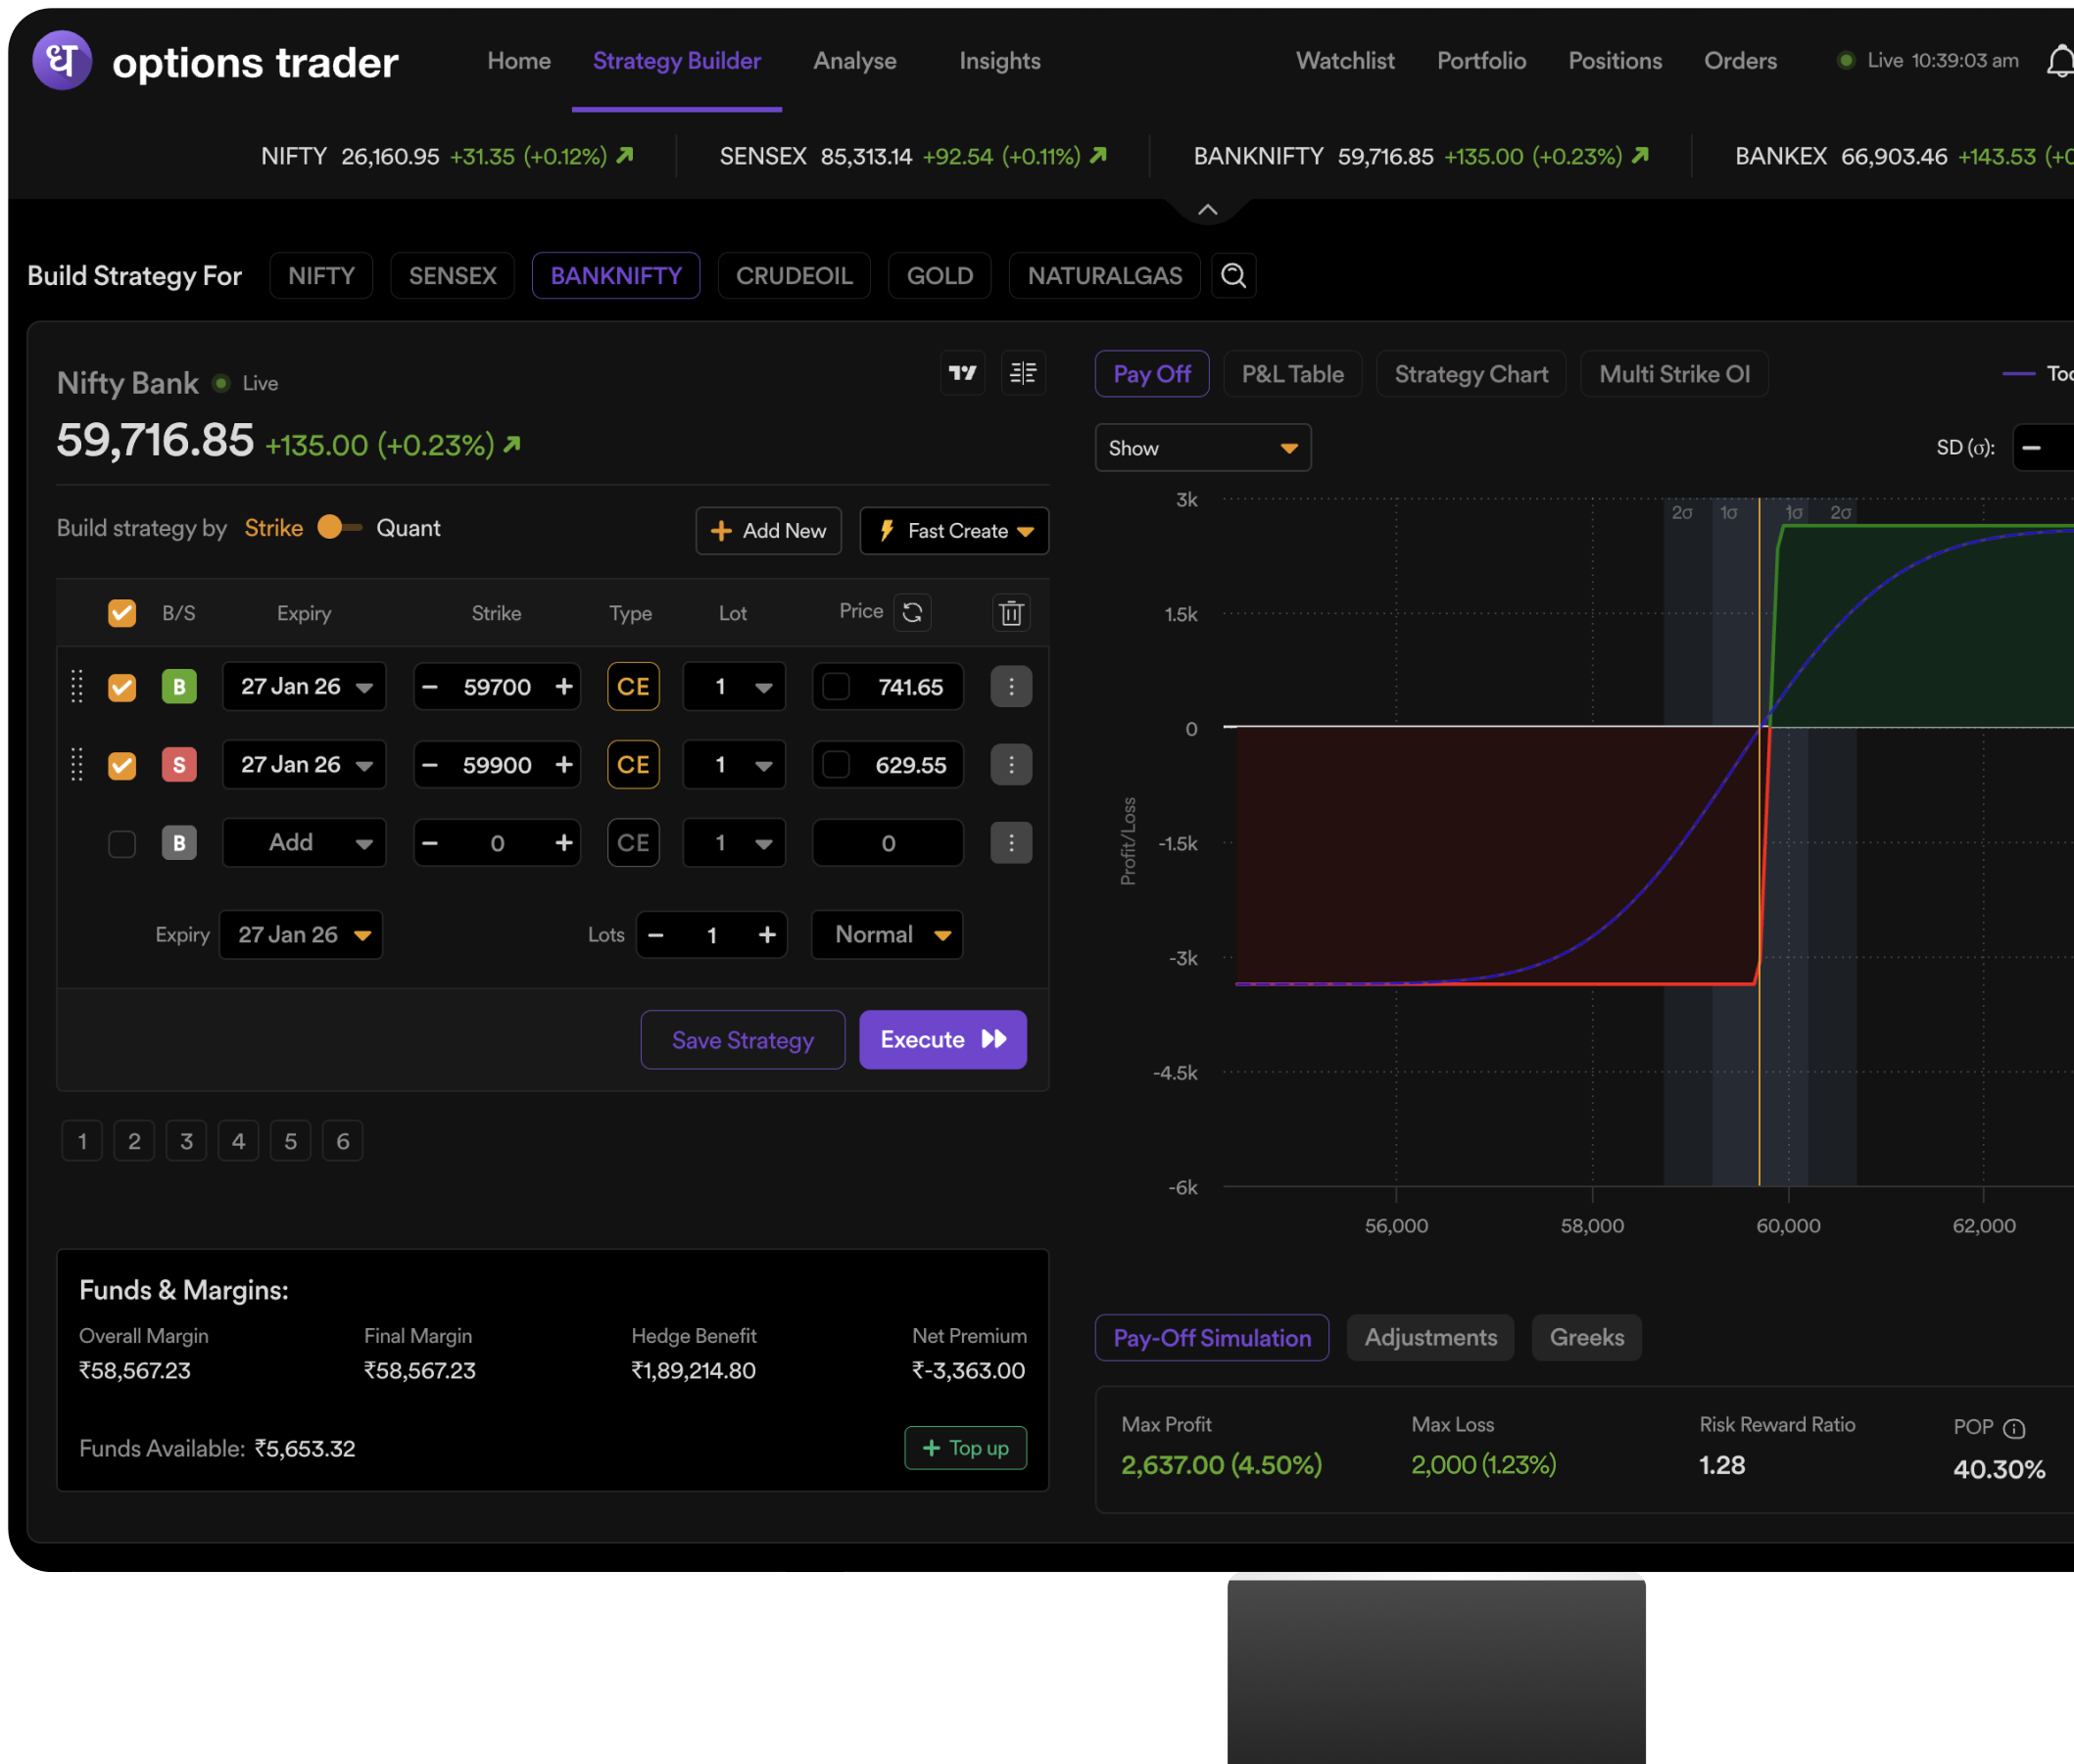
For example: Nifty is at 24,200. The 24,000 strike has been steadily rising in terms of put OI, while the 24,500 call OI has been steadily declining. The PCR is above 1.10. A trader sees this as a market that offers a clear support level at 24,000 and resistance that is fading at 24,500, and sets up a bull call debit spread (long 24,200 CE, short 24,500 CE) to benefit from the upside with a defined risk level. Traders can use Options Trader's Strategy Builder to build this strategy.
Conversely, when calls OI are aggressively accumulating at lower strike prices, it indicates that smart money is writing calls to limit the upside, and they are anticipating that the market will not move above those resistance levels.
For example, Bank Nifty is trading at 51,800. The 52,000 call strike is witnessing a significant increase in fresh OI, whereas the 51,500 put OI is getting unwound. PCR has declined to 0.78. A trader sees this as strong resistance at 52,000 with support eroding below, and decides to buy a bear put spread (long 51,800 PE, short 51,500 PE) to benefit from a controlled downside move. This strategy can be developed on Option Trader's Strategy Builder.
In high IV environments, premiums are inflated due to expected volatility. Professional traders often utilise credit spreads or short straddles to benefit from the eventual contraction of these premiums as IV returns to the mean.
For example, India VIX rises to 22 before a major event. Nifty ATM straddle premiums are significantly higher than their 30-day average. A trader is selling a short strangle (24,500 CE and 23,500 PE) and receives a higher premium on both sides. The trade is based on the assumption that the price move after the event will be less than what the IV is implying. This strategy can be developed on Strategy Builder.
When IV is low, the cost of insurance is relatively cheap. This makes it an ideal time to buy options and implement options buying strategies, like long calls or debit spreads, as when IV is low, the risk is limited to the low premium paid.
For example, India VIX declines to 11.5, close to its 52-week low. A trader who is bullish on Nifty before an upcoming earnings season buys a long call at the ATM strike. The premium is small in absolute terms, the max loss is limited to the premium paid, and if the market rises with an IV expansion, the position benefits on both fronts. Traders can build this strategy on Strategy Builder.
In intraday trading, it's more important to watch for changes in OI than absolute OI, as this reflects the real-time shifts in positioning. Traders look for sudden spikes in OI at specific strikes to identify immediate support and resistance zones.
When the price approaches a strike carrying heavy Call OI, and that OI keeps increasing, intraday traders identify that they have a high probability of a shorting opportunity.
On the other hand, when large OI starts to unwind rapidly at a key strike on the expiry day, traders expect a breakout to occur soon as the option sellers start to abandon their defensive positions.
These two are complementary, but they are used for different analytical purposes and should not be used interchangeably.
An option chart is a time-series price chart of an individual option contract's premium, which displays how the price of a specific call or put has evolved over time, and can be analysed using traditional technical analysis tools like moving averages, RSI, or candlestick patterns. It helps in timing entries and exits on a premium basis and assists in visualising how a specific contract reacts.
The option chain, on the other hand, is a multi-dimensional, cross-sectional view of the entire options market for a specific underlying and expiry at a fixed point in time. It indicates where participants are positioned, how heavily traded each strike is, the volatility expectation on a strike-by-strike basis, and the net direction bias across the matrix.
Option chain analysis is structural as it shows the landscape within which price action plays out. The option chart is tactical, as it's to help traders execute within that landscape.
Both are used by advanced traders in combination to benefit from both as the chain defines the setup, while the chart times the trade.
Options Trader is a platform built specially for the F&O traders who require a robust options trading platform with advanced features. Here is what sets it apart:
If the Put-Call Ratio (PCR) is above 1.0, it signals bearish market sentiment, as more traders are buying or holding put options than call options. This indicates that traders are anticipating a decline in the prices of the underlying assets or are looking to hedge against a potential drop in prices. However, extremely high PCR (>1.5) indicates a high degree of pessimism, which can sometimes be a contrarian bullish indicator anticipating a rebound.