






Spot Opportunities & Trade with Confidence. Open a Free Trading Account Today!
+91

Login for real-time prices and trading.

Even without logging in, Options Trader gives you access to NSE option chain data to explore the market structure. Here's what's available:
The pre-login view allows you to analyse the NSE Option Chain, but for time-sensitive decisions, logging in unlocks the full picture.
The NSE option chain is a real-time structured data published by the National Stock Exchange (NSE), which contains all the available call (CE) and put (PE) contracts at various strike prices and expiry dates for the indices and stocks. It indicates where traders are buying or selling their trades.
The live NSE option chain is different from price charts as it indicates where traders are betting, rather than what has transpired in the market. This makes it a forward-looking tool, which is widely used to identify support-resistance zones, volatility expectations, and directional bias.
On Options Trader, this data is directly taken from NSE's official platform and is updated in real-time during the trading hours.
At first glance, the NSE option chain data appears as a table, but each column in it represents a specific layer of market behaviour. Calls (CE) are present on the left side, puts (PE) on the right side, and strike prices in between.
Reading the option chain is not about analysing it row by row, but rather interpreted structurally, i.e., traders look at how OI, volume, and IV change across strikes.
The strike price is the price at which the option contract can be exercised, and the spot price is the current price of the underlying index or stock. The strike price that is nearest to the spot price is known as an At-The-Money (ATM) strike, and it is often used as the benchmark for most NSE Option Chain analysis.
The NSE option chain consists of two sides, calls and puts, which represent different directions.
Last Traded Price (LTP) is the current price at which an option contract is traded. Traders don't just look at LTP; they also look at how LTP reacts at the ATM and near strikes. A sudden surge in ATM premiums is often a sign of momentum, and a lack of premiums even as prices move is often a sign of absorption.
Volume represents the total number of contracts traded during a session and acts as a real-time indicator of market activity. Traders often use volume in combination with other indicators, such as:
Open Interest is the backbone of NSE option chain analysis. It is the number of outstanding contracts that are still not closed, exercised, or expired in the market. Most importantly, OI assists traders in interpreting the price action. There are four types of relationships between price and OI:
These patterns indicate whether traders are entering or exiting the trades.
Implied Volatility is the market's expectation of future price action. It is a key driver of option pricing and plays a central role in strategy selection. IV chart is also frequently analysed along with India VIX in the Indian context. The higher the IV, the more it inflates premiums, and vice versa, which has a direct impact on risk-reward.
Option Greeks measure the sensitivity of option prices to various factors in the market.
| Greek | What it measures | Practical implication |
|---|---|---|
| Delta | Sensitivity to price changes | How much the option premium will move for every ₹1 change in the underlying asset. |
| Gamma | Rate of change in Delta | The acceleration of directional risk; higher Gamma means rapid and aggressive price swings. |
| Theta | Sensitivity to time decay | The daily loss of premium simply from holding the contract as expiry nears. |
| Vega | Sensitivity to implied volatility | How much the premium inflates or shrinks when market volatility expectations shift by 1%. |
| Rho | Sensitivity to interest rates | How much the premium changes for a 1% shift in interest rates (rarely impacts short-term/weekly trades, but matters for long-term options). |
Logging in removes the delay and default limits, giving you the complete, real-time NSE option chain with full interactivity across strikes, expiries, and Greeks.
Once logged in, the 15-minute lag disappears entirely. LTP, OI, Change in OI, Volume, and IV updates in real-time.
The non-logged-in view caps the view at the next 4 monthly expiries. After logging in, all available expiries on the NSE are accessible, including weekly and monthly expiries.
Open Interest and Implied Volatility shift from static, delayed figures to real-time updates. As shifts in OI and IV are often the earliest markers of changing market structure, having them update in real time lets traders spot positioning changes as they build, not several minutes after.
Beyond raw data, traders rely on various indicators derived from the NSE Option Chain to interpret the broader market structure.
The Put-Call Ratio is calculated by: PCR = Total Put OI / Total Call OI
Traders frequently use it to assess if the market is excessively bullish or bearish. It may also indicate a potential price reversal. When PCR is greater than 1, it indicates that the put volume exceeds the call volume, signalling a bearish market sentiment.
In contrast, when PCR is below 1, it indicates that the call volume is greater than the put volume, signalling a bullish market sentiment. However, extreme PCR readings are often used as contrarian indicators.
The strike where option sellers collectively retain the most premium at expiry and where option buyers face the highest aggregate losses is known as the Max Pain strike. It is based on the observed tendency of underlying prices to gravitate toward this level as expiry approaches.
Max Pain updates consistently during the expiry cycle as fresh OI is built or unwound. It is most actionable in the last 30 minutes of the NSE expiry day.
In this window, large option sellers who have written positions near Max Pain actively defend it by selling the underlying if it rallies above, or buying if it falls below, thus creating a measurable pull toward that strike at close. Market participants use Max Pain to anticipate where a stock or index will settle on expiration day.
IV is only meaningful when compared with its historical range as well as other volatility indicators, such as India VIX. However, if the India VIX is high, there is fear in the market, and the cost of options premiums increases, making them expensive.
Alternatively, if the India VIX is compressed, the options premiums will be cheap, and buying options with a defined risk will present robust value.
The professional traders adjust their strategy based on the insights obtained from the NSE option chain.
A bullish formation occurs when the structure shows strong downside protection and resistance is weakening. Its signals include:
This indicates that the market has a defined floor and is likely to move upward. For example, if Nifty is trading at 24,200. The 24,000 strike shows fresh put OI additions for three consecutive sessions, and the 24,500 call OI is gradually decreasing. PCR has moved from 0.95 to 1.10. A trader interprets this as a defined floor at 24,000 with a fading overhead resistance, and sets up a bull call spread (long 24,200 CE, short 24,500 CE) to take advantage of the upside potential while limiting the downside risk. Traders can build this strategy using Options Trader’s Strategy Builder.
The bearish structure signifies that there is no support, and supply is dominant. Its key signals include:
This indicates that there is limited upside potential and increased probability of downside movement. For example, Bank Nifty is trading at 51,500. The 51,800 call OI has witnessed a sharp single-session increase of 8 lakh contracts, whereas the 51,000 put OI is unwinding. PCR declined from 1.05 to 0.78. A trader interprets this as a strong resistance ceiling and support eroding below, and thus they enter a bear put spread (long 51,500 PE, short 51,000 PE) to profit from a controlled move lower. Options Trader’s Strategy Builder can be used to build this strategy.
High IV environments have higher premiums because there is more uncertainty. This allows option sellers to take advantage of the time decay and the volatility contraction. Common approaches include:
These strategies are best suited when markets are likely to stay in a range. For example, India VIX rises to 21 before a major event. The ATM Nifty straddle premiums are significantly higher than the 20-day average. A trader sells a short strangle (24,500 CE and 23,500 PE) and collects a higher premium on both sides. The trade is based on the assumption that the price move following the event will be less than what the IV is implying. This strategy can be built on Dhan's Strategy Builder.
Low IV environments offer cheaper entry into option buying strategies. Here, traders look for expansion in volatility along with directional movement. Common strategies include:
The edge lies in capitalising on both price movement and IV expansion. For example, India VIX declined to 11.8, close to its 52-week low. A trader who is bullish on Nifty buys a long ATM call before a macro event. Premium is low in absolute terms, max loss is limited to the premium paid, and if the market moves up with an IV expansion, the position benefits from both the directional move and the volatility re-pricing.
Intraday trading requires focusing on changes in OI rather than static levels. The live NSE option chain becomes especially useful when used in combination with real-time price action. Traders closely monitor:
For example, if the price is nearing a strike where there is heavy Call OI and that OI is still increasing, it often acts as intraday resistance. On the other hand, when rapid unwinding occurs at the key strike, it may indicate weakening resistance/support and the potential of a breakout.
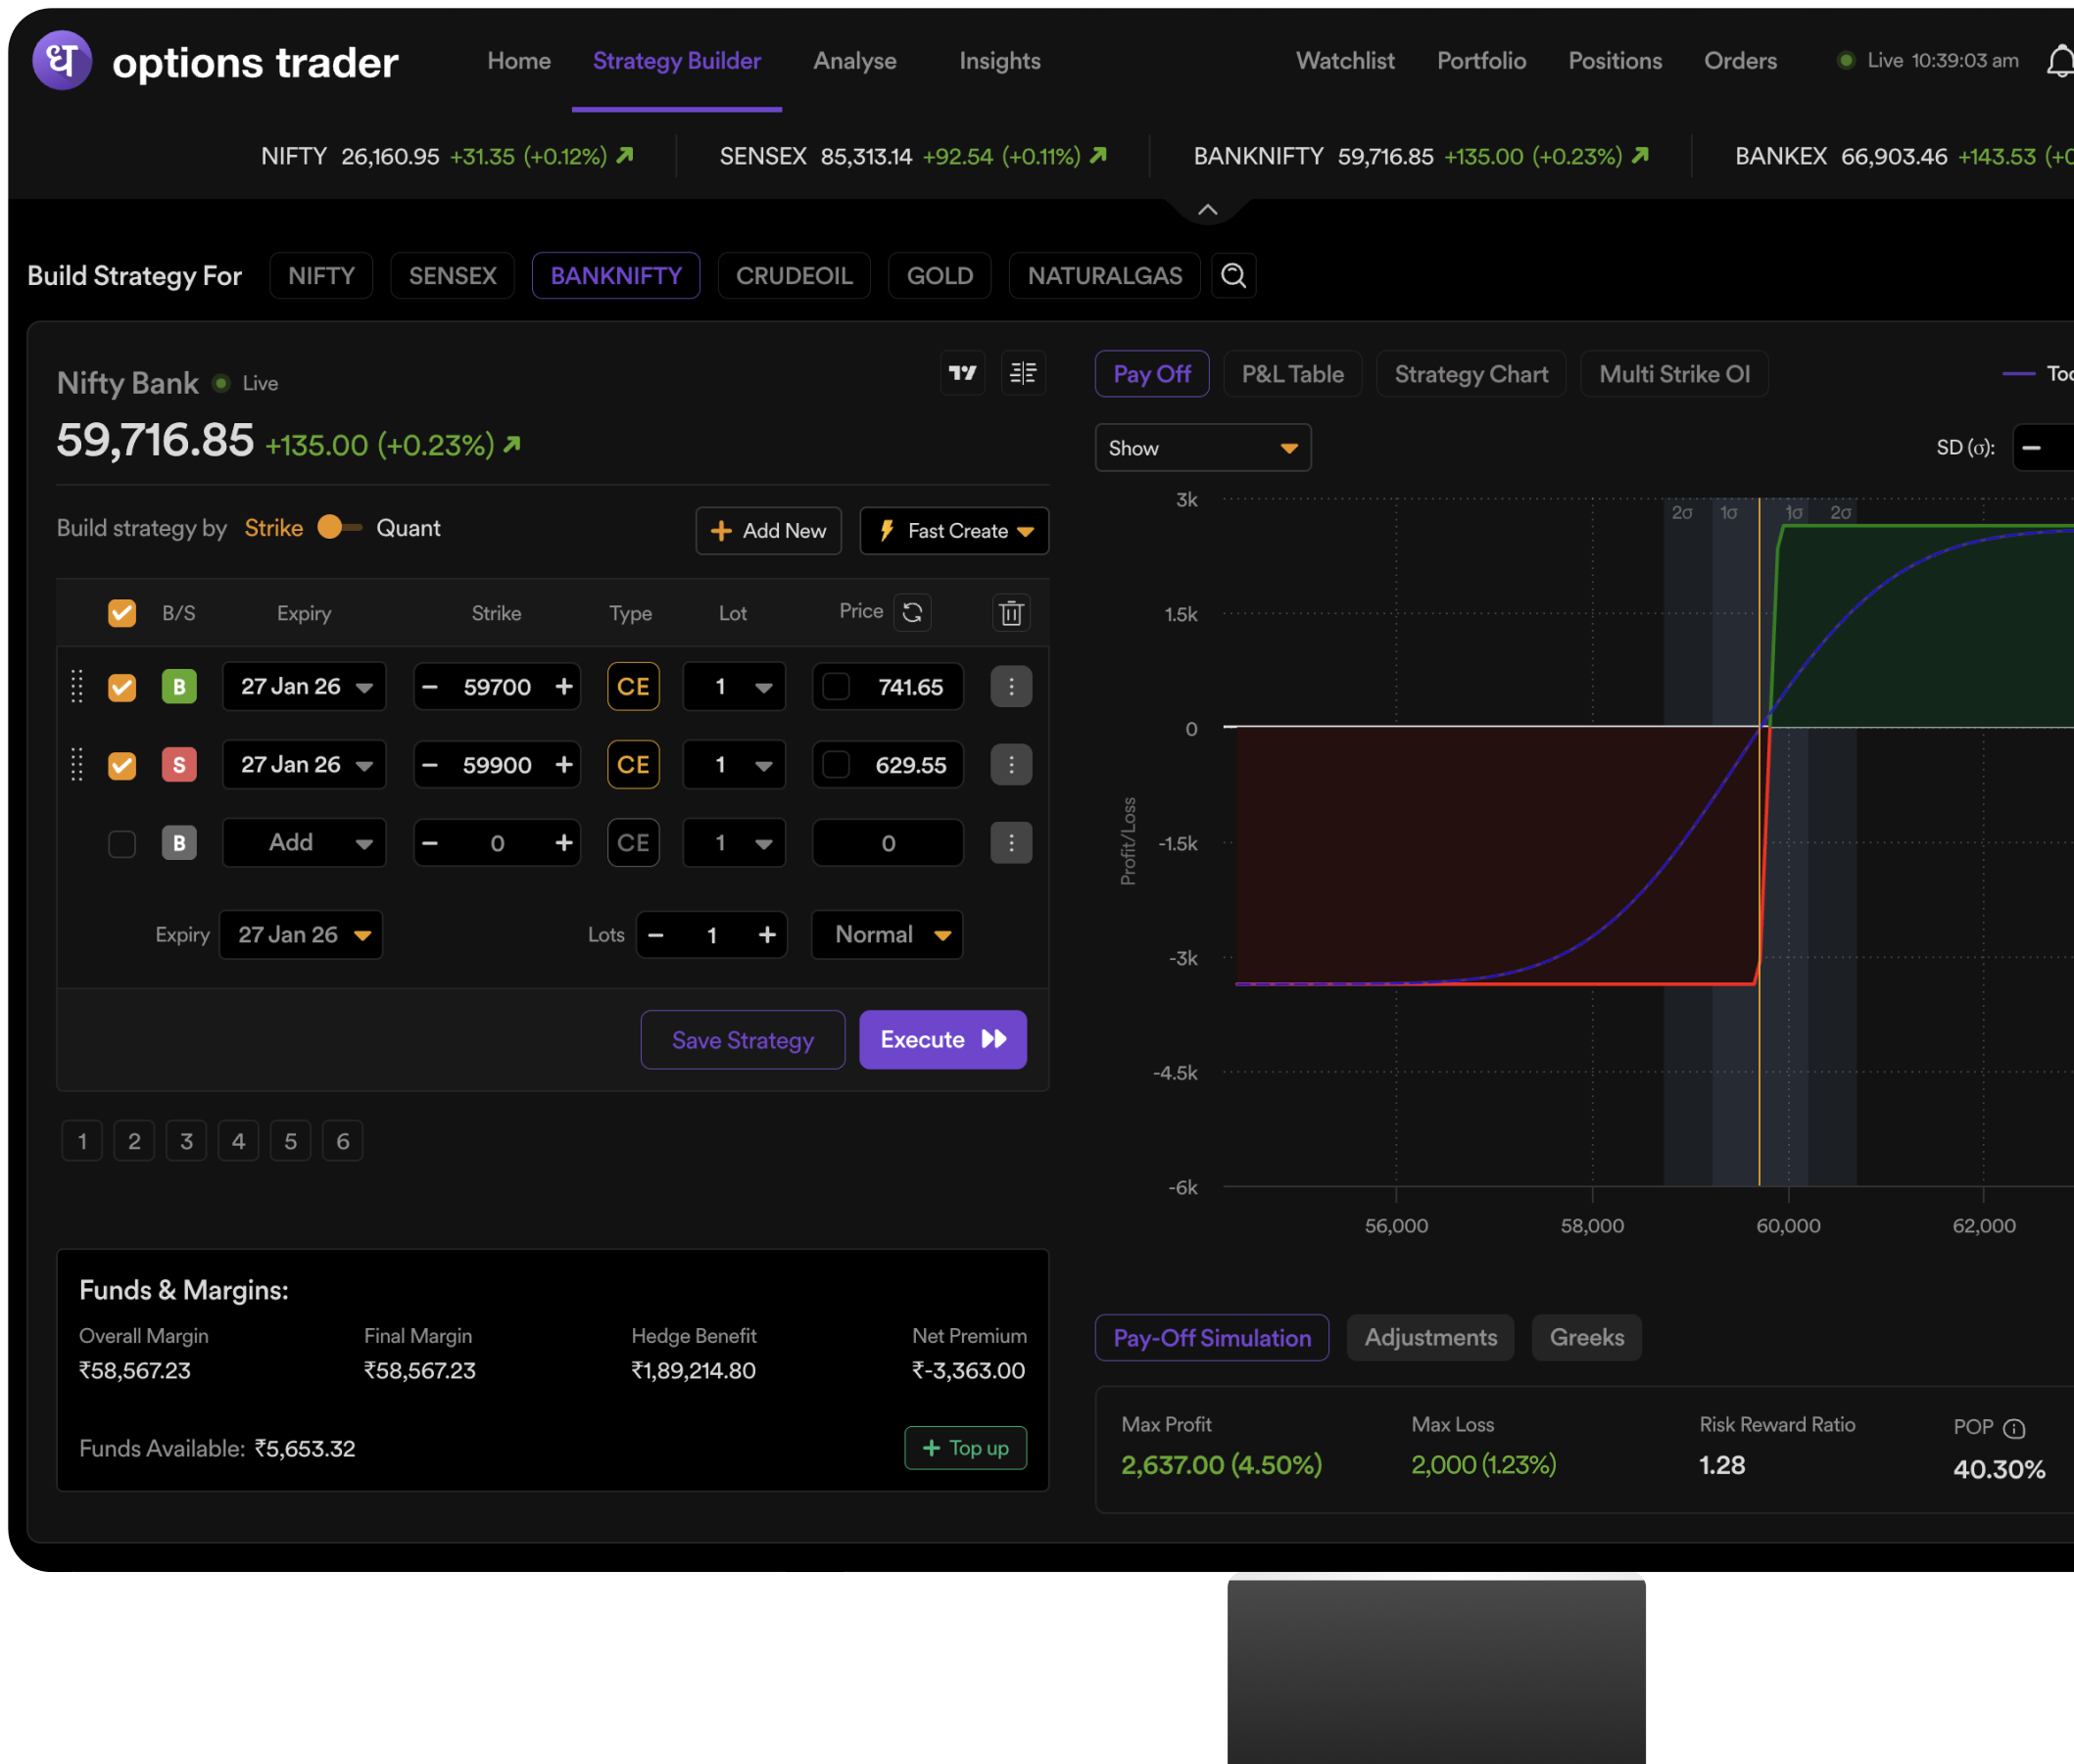
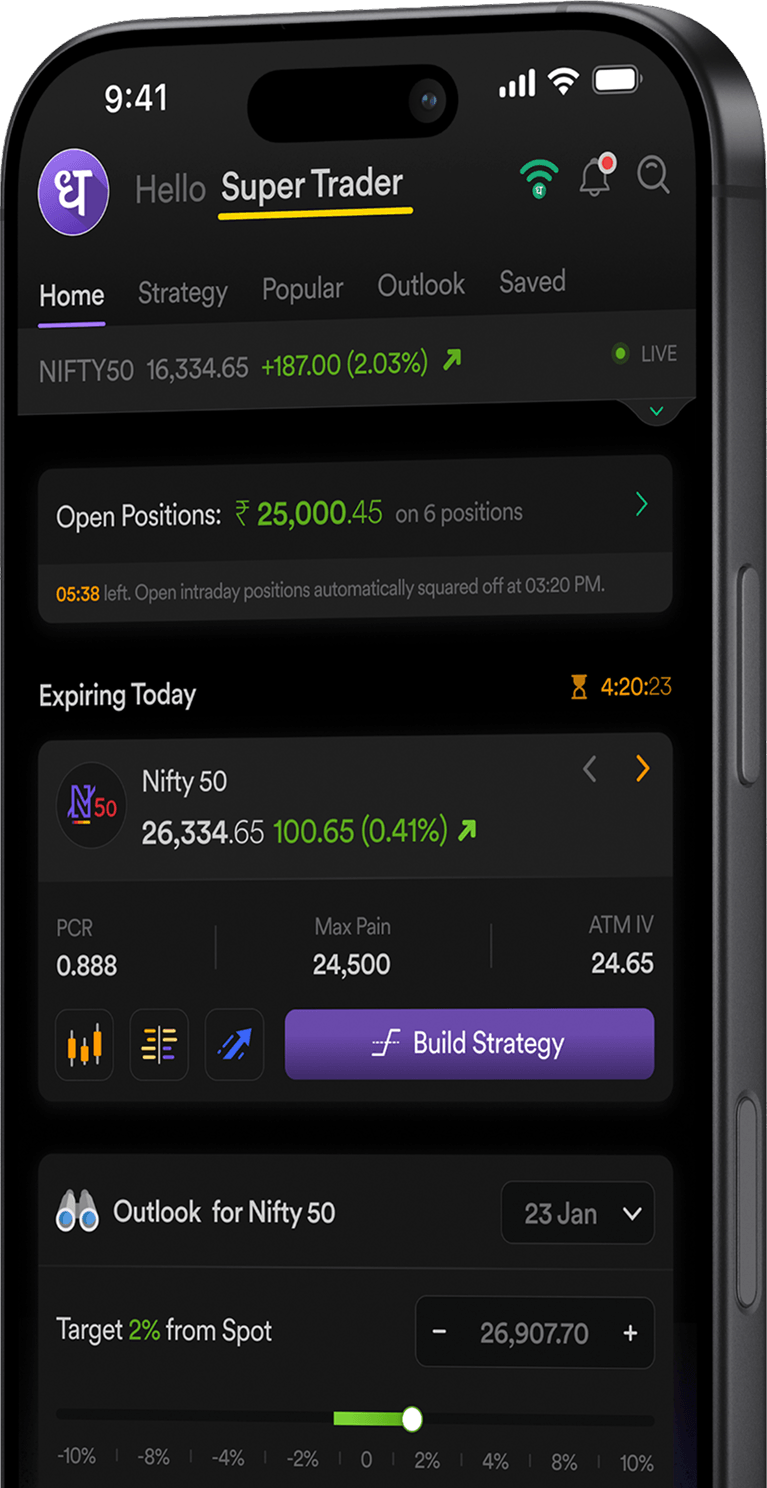
Options Trader by Dhan transforms the raw option chain data from NSE into an actionable trading interface. It is built specifically for F&O traders with an aim to offer speed, transparency, and execution efficiency.
With Options Trader, traders can analyse and execute trades from a single platform rather than having to switch between multiple screens. Its key capabilities include:
Both of these expiries have a different purpose, and it depends on the trader's trading style. Weekly expiries are faster and more responsive. They are favoured by intraday and short-term traders because of higher gamma and rapid premium decay.
On the other hand, monthly expiries provide stability and are more suitable for positional trading strategies, where traders aim to capitalise on a broader trend.
The weekly expiry for NSE equity or index options, such as Nifty, usually occurs on a Tuesday. In the event that Thursday is a trading holiday, expiry will be moved to the previous trading day.